Application: analog input from temperature sensor to indicate whether water is cool enough to drink. As shown in the videos below, when the temperature sensor is attached to a cup of water at 30 degree Celsius, green LED is lit, indicating ok to drink; when sensor gets close to a cup of hot water >57 degree celsius (I picked the value from a study which claims the optimal drinking temperature of hot drink is 57), red LED is lit, indicating it's too hot to drink. Of course the temperature threshold here is arbitrary, I can adjust the value to whatever I want.
Read MoreW2 Reading reflections
Chapter 1 The Psychopathology of Everyday Things of Design of Everyday Things has provided me some very great insights on principles of physical design. Author Norman has illustrated his ideas with many real life good and bad examples like telephones, cars, and watches which I can closely relate in my everyday life. I understand that how we work/use/operate things should be reflected by the design of the things themselves without any needs for words or symbols.One of the most important principles of design is visibility. Natural design gives natural visual cues to convey how to correctly work with things. A successful design should have visible instruction or cues with feedback of actions, and there should be enough feedback for different features. There should also be a close relationship between what you want to do and what seems possible when mapping things. Natural mapping between a control and its function comes from physical analogies and cultural standards, rather than arbitrary decisions. There should also be constraints to limit the possibilities to avoid confusion. The psychology of materials/affordance of things(purpose) also matters: different materials is used for different things, which also direct people to interact with things differently.
Read MoreW1 Create a digital, audio-visual, sample based instrument
As I'm still a beginner user of the p5js web editor, for this audio-visual sample based instrument assignment, I was only able to create some simple visuals. The best sound sample to go with my visual is minimal ambient and analog sounds. I used two samples from freesound.org I named ambient and signal. I also referred to p5 sound library to generate an oscillator with new p5.noise() as the third sound.
I started with creating a snow screen with all random greyscale pixels similar to the old fashioned static TV screen. Then I had key 'a' to toggle play ambient.wav and the snow screen.
Then I used mousePressed() to turn on signal.wav, which is a higher pitch white noise. At the mean time the snow screen turns into RGB scale from greyscale. When mouse is released, however, the RGB is turned off.
Finally I created a greyscale slider reactive to mouseX, to change the bandpass frequency of the filter of the p5.noise oscillator generated. I referred to: https://p5js.org/reference/#/p5.Filter . The bigger the mouseX value is the higher the frequency.
The longest time I spent when I was stuck was to figure out how to toggle play with key and mouse, using boolean aPressed, sound.IsPlaying(), and figure out how to use event functions like keyPressed(), mousePressed(), mouseReleased() .
I wanted to keep this first project relatively simple as I slowly start to build my programming skill. Therefore I did not spend much time worrying about the sound input.
my code: https://editor.p5js.org/ada10086/sketches/SJz68kd_Q
A screen recording of me playing with the instrument:
https://youtu.be/G0yhnVROViA
W2 Sketch
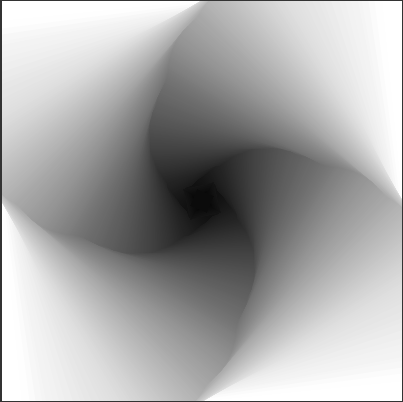
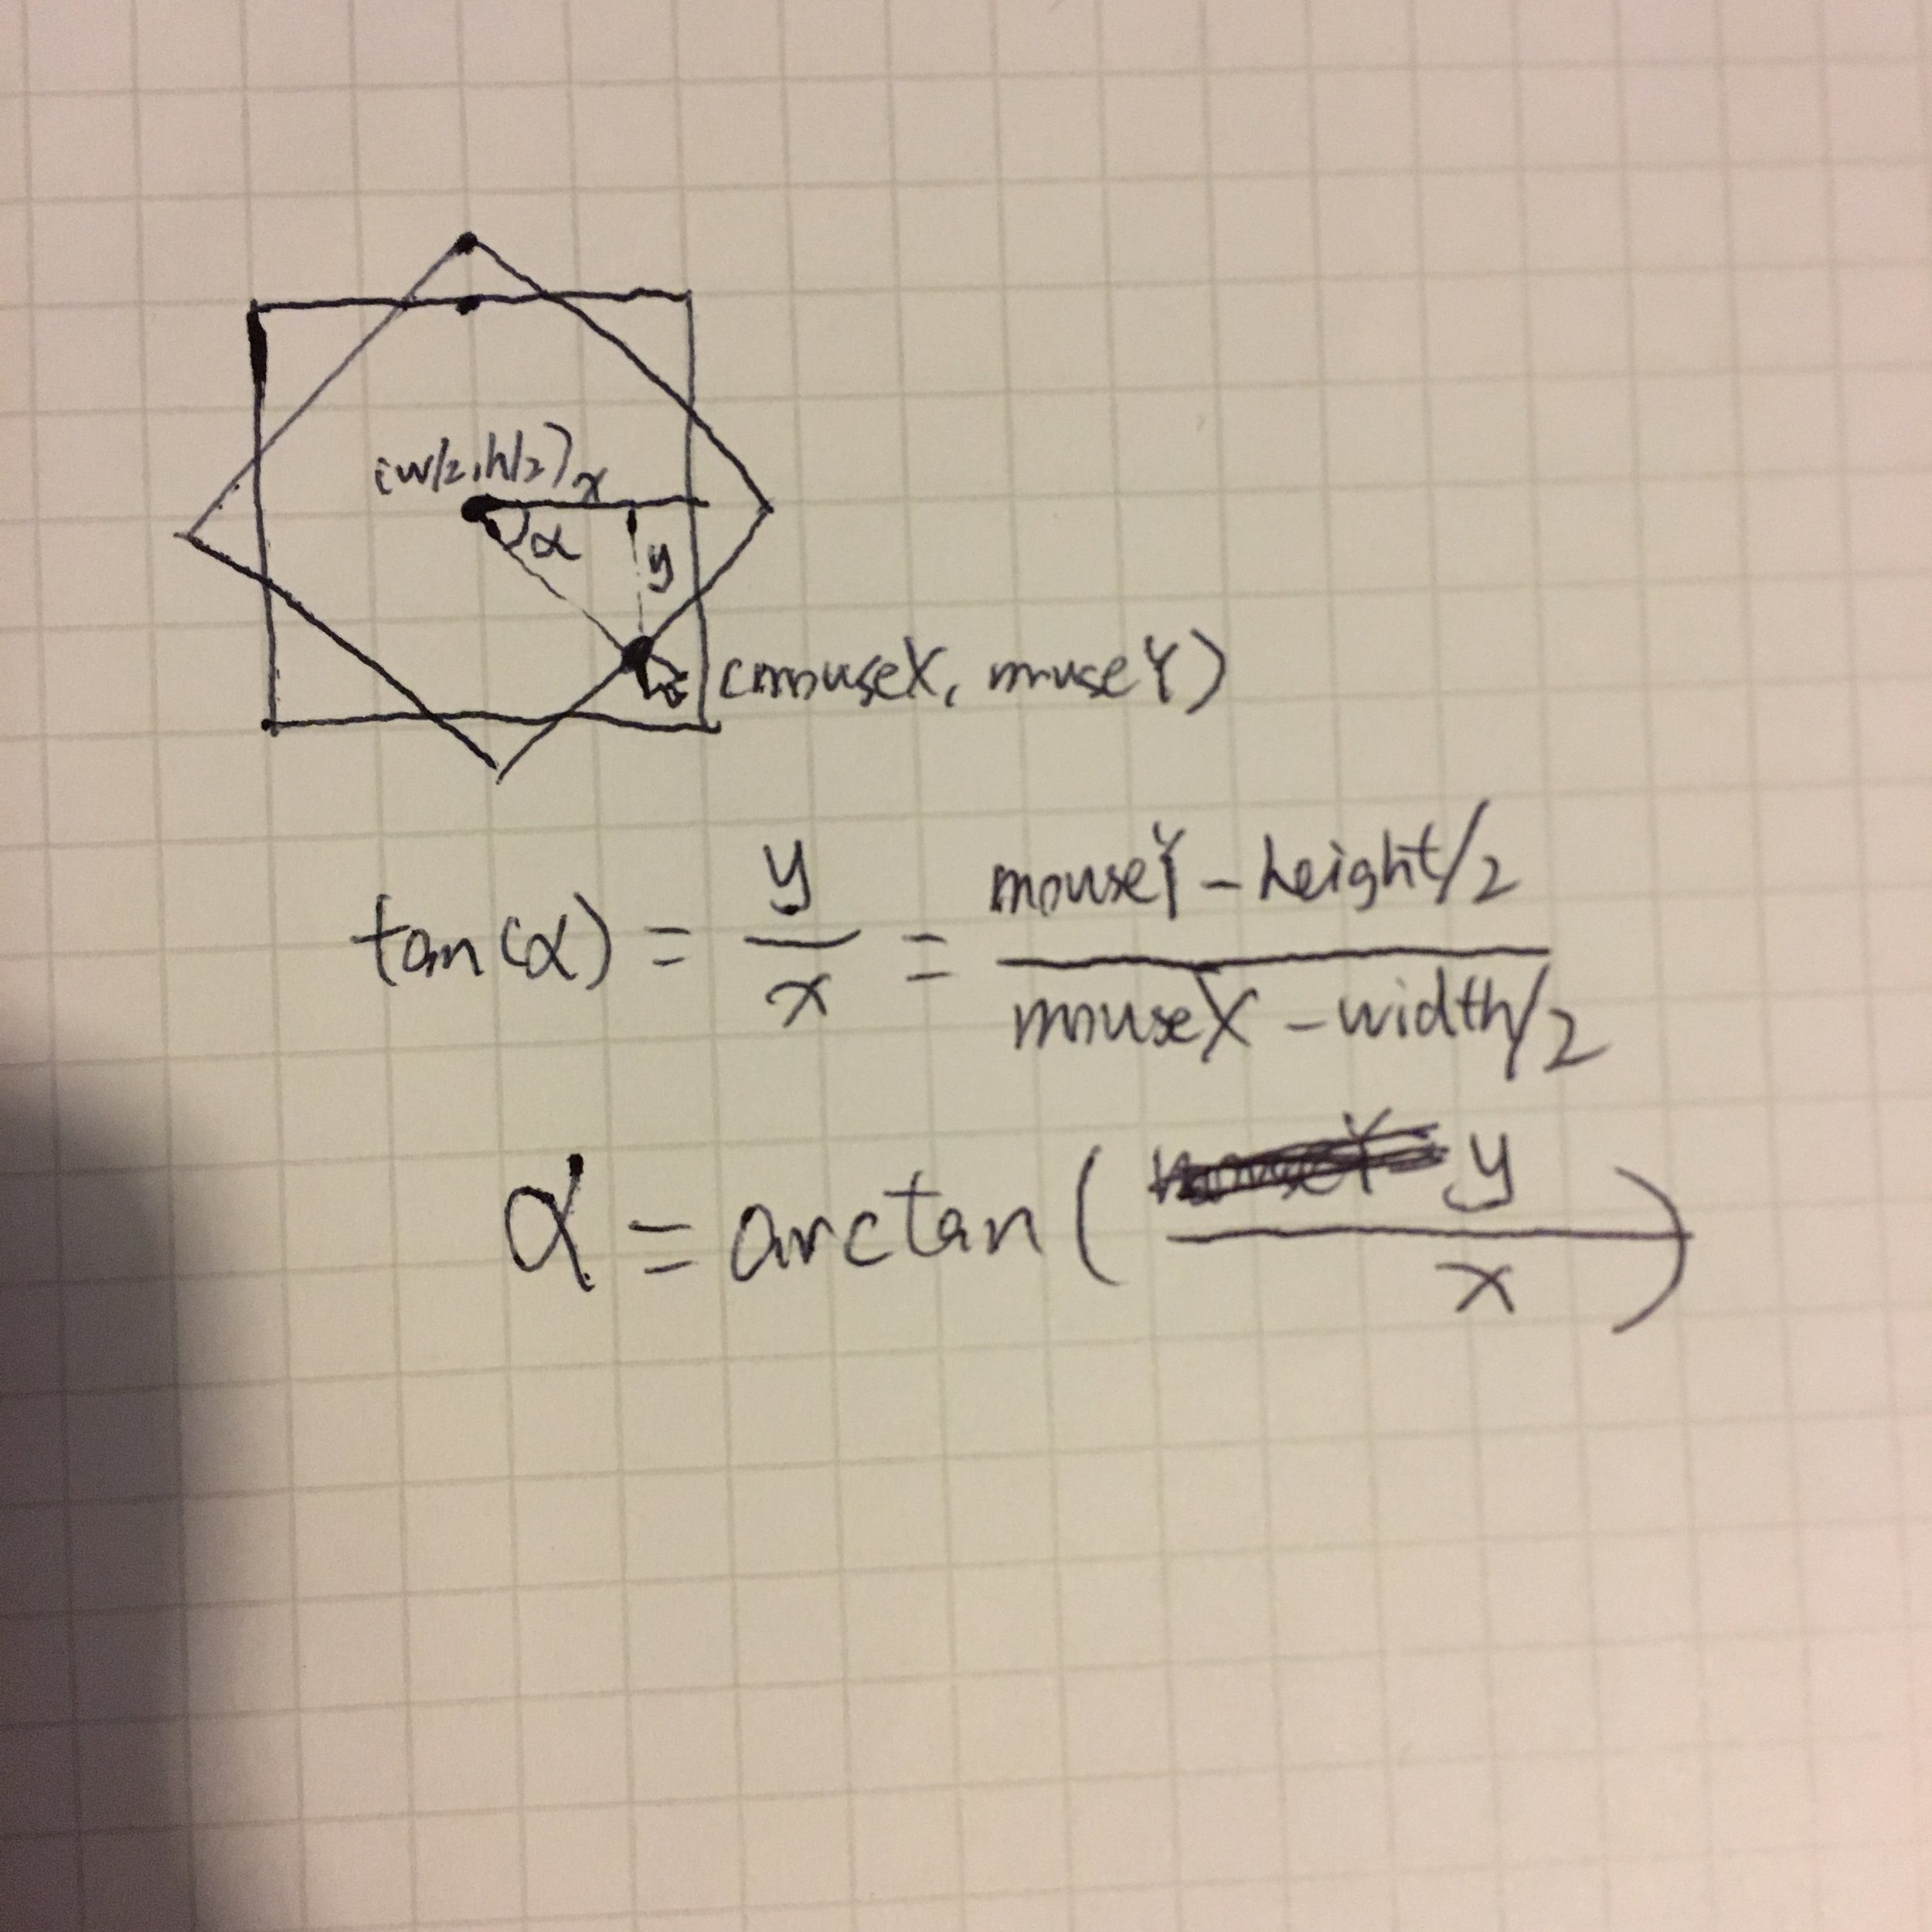
My week 2 assignment I have my background generate a random greyscale color every time i run the sketch. Then drew a square in the middle of the canvas with its size and rotation controlled by mouse position. The size is determined by the distance between mouse position and the center of the canvas, s=dist(width/2,height/2,mouseX,mouseY); The rotation angle is controlled by mouse position relative to the center of the canvas. I drew this diagram to better illustrate how I derive the angle of rotation from mouseX and mouseY, by using arctangent formula, in p5js reference, I found atan().
Then I drew four smaller rectangles on four corner of the canvas and have them rotate and change color over time independent of the mouse.
I found it mesmerizing to play with the image. Depending on the speed I move my mouse and the direction I rotate my mouse, each time I create completely different effect like the ones below.
link to my sketch:https://editor.p5js.org/ada10086/sketches/S1y0dvB_X
W2 Lab - Lab Electronics
Lab Electronics
I used the ToolSmart Digital Multimeter, a bluetooth enabled auto-range multimeter.
Read MoreW1 Reading Reflections
Hands really are amazing "tools" we all inherently own since the beginning of the humanity. It is amazing how a great variety of intricate tasks we can accomplish with our bare hands as we grasp, touch, pick, thump and performing all kinds of movements. Bret Victor's “A Brief Rant on the Future of Interaction Design” is looking at today's technology innovation from a different perspective. Rather than emphasizing on the human demand(need) or functionality improvement(technology) or fancy interfaces, he inspired creators/designers to think more about untapped human capabilities like what other things our body parts, not limited to hands, can do instead of simply touching and dragging on the "Pictures on the Glass". He calls attention to our bodies' tactile abilities to feel and sense things, which can be easily ignored when we orient our technologies around glassy visual displays. He plead to not bypass some human capabilities we take for granted. As the starting point and the center for any design is human. I was interested in how he discusses the brain interface in response to others' comments. Technology should not sacrifice/decrease our bodies' capabilities, rather it should be adapted to fit our bodies and to expand our capabilities. The future of interaction design is calling for more extensive human research than ever.
Read MoreW1 How computation applies
W1 Sketches
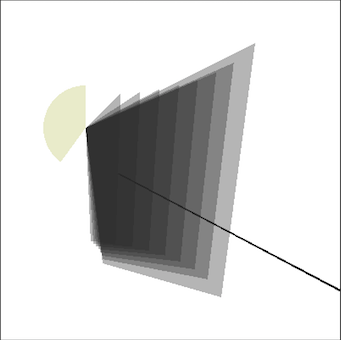
Having some degree of knowledge in programming with Processing, I was able to quickly pick up what I used to know in Processing and apply it in the p5.js web editor. There are a lot of similarities given that both are intended for drawing. In first week’s of progress, I have also learned many differences through both the lecture and assignments. Processing uses the programming language Java and runs locally on the computer, whereas p5.js is in Javascript and runs on the webpage, making it easier to share. Instead of “void setup” and “void draw” in Processing, p5.js uses “function setup” and “function draw”; Processing uses “size” to define size of canvas, while p5 uses “createCanvas”; “pushMatrix” and “popMatrix” are now simply “push” and “pop”. Origin (0,0,0) for WEBGL mode in p5 is in the center of the canvas. “println” is now “print” or “console.log”. My first sketch is a static abstract structure I named “gate”, I randomly jot down some coordinates with beginShape() vertex() endShape() and ended up with an irregular quadrilateral. I then made duplications of the quadrilateral by rotating it in 3D space. So I looked up in the reference, in order to sketch in 3D, I need to set up my canvas as WEBGL in createCanvas(400,400 WEBGL) in function setup. Then I rotated the quadrilaterals around Y axis, and each time I added the rotation, I scaled down the sizes proportionally, so they overlapped and created a sense of depth. One problem I encountered was when I changed to WEBGL mode, my shapes shifted a little, and I found out the origin is no longer on the top left corner, instead it is in the center of the canvas. So in order to shift things back in the middle, I used push(), pop() and translate(). Then I added a line as a ray crossing the quad gate and an arc on the left to balance the abstract image. Having some prior knowledge with statements like for/while, if/else, I was aware that I could use fewer lines of code to produce this graphic with for loop by incrementing/decrementing the rotation degree and the scale of each loop. However, since the week 1 assignment focuses on using simple 2D primitive shapes, I thought I’d recreate this when we talk about for loop.
In my second dynamic sketch, I wanted to create something that’s not just triangles, circles or squares, which I used to play around a lot in Processing, so I thought about polygons. And I found the polygon documentation in the p5.js reference. Unlike a single line function like ellipse() or rect(), a polygon() function does not already exist in the p5.js library. So before calling polygon() with some parameters, I had to first declare my own polygon function with input parameters (center x coordinate, center y coordinate, radius, number of points). After understanding the math behind the polygon parameters, I generated a heptagon and a triangle with the polygon function and used push(), pop(), translate() to move them to the center of the canvas. Then I decided to animate them with rotate() by passing frameCount into the function. As frameCount is always going up, it ensures the shapes are constantly rotating. Then I was just playing around with the parameters of the shapes and multiplied the radius of the polygons with sin and cos values so that the radius increases and decreases rhythmically. I also moved background() into setup so that each time the draw loop updates, the last sketch stays, leaving behind a trace of previous shapes, creating a hypnotic effect.

My takeaway from this assignment is that without a specific goal in mind of what I wanted to create in the first place, it is always fun and rewarding to start with something very simple and gradually adding things on top of it and play around with parameters and move things around. The results can be very interesting and unexpected.
W0 Music Sharing — Stephan Bodzin – Lila
Picking one piece of music to share is the hardest thing for me ever. I stumble upon millions of amazing creations and get inspired every second of it as I listen to at least 5 hours of music on an average day. A handful of great pieces came to my mind while brainstorming which one I'd like to share with The Code of Music class. I found "Lila" by German producer Stephan Bodzin from his album "Power of Ten" might be a great example of new media art in the form of digital audio production and computer generated graphics. The visual representation resembles simple crayon-drawn vertical lines increasing in its quantity, while gradually intruding towards the viewers from its 2D plane into 3D space. The simplicity in this animated graphic represents the great depth and power in the rhythmic layers and beautiful chord progression in the music. I remember when I first came across this song I was in awe as it evoked so much emotional response and threw me into deep contemplation. I found it hard to pick a 30 second part because the song is more about the structural add-on and subtle development throughout the 7 min duration than it is about the traditional verse-chorus-verse musical structure. However if you do not have enough attention span to enjoy the whole song, I suggest slowly scrolling through different parts of songs from beginning till the end and notice the change in graphic and musical progression.
https://youtu.be/jF_hBX-6x9s

